
Introduction to MMM
Marketing Mix Modeling (MMM) has been around for over 30 years and almost every marketer at least once has heard about it. It was first introduced in the 1980s as a tool for analyzing the impact of various marketing activities on sales or any other business metric. The idea was pretty simple: if we can use multiple regression analysis to describe processes in economics, why not use it to establish a relationship that describes the responsiveness of sales to marketing spending?
Since then, the methods and approaches have changed and improved, the amount of data increased, which led to the rise of alternative methods for measuring marketing effectiveness such as attribution models, but MMM stands as the most useful and essential tool for optimizing marketing strategies.
Due to recent changes in privacy regulations regarding the user data, it’s getting much more challenging to implement third-party cookies into analysis. That is another reason to rely on MMM for measuring campaign performance. It only needs aggregated data to function and will not be affected by the phase-out of third-party cookies.
However, MMM also may be challenging for those who want to use it in decision-making, because it is not a simple process. You can’t just push a button and get all the insights. Businesses may need an extra data science resource with expertise in statistical modeling, data analysis, programming and besides a good understanding of marketing concepts, business logic and goals. The process of MMM requires collecting and preprocessing the data, developing automated or semi-automated pipelines to clean and integrate the data into the models, setting up the model and its specification, running the analysis and interpreting the results.
The final result should not only satisfy all the statistical assumptions and requirements but also reflect the reality of the business and its objectives. Furthermore, after the model is built, validated and accepted for production, there comes a consulting phase where results must be interpreted and transformed to a human-readable form with conclusions and actions to achieve the business goal. In simple words, we want to use the model results to optimize marketing spending, gain those “insights” of how and what to change to get what we want for our business.
All these tasks require not only the ability just to build a marketing mix model but to make it as transparent, interpretable, and not human-biased as possible. There are several advanced solutions on the market with different deployment options that specialize in different geographies. And with the growing demand for a solution that doesn’t depend on third-party cookies, a few open-source MMM tools have been released recently. One of the most famous among them at the moment is Robyn MMM made by Meta.
Facebook Robyn MMM
- Robyn is an experimental, semi-automated MMM package from Facebook that was first mentioned in 2021. It comes in the form of R.script with instructions to help with the set-up process. You can also find online guides and courses on how to work with it. It’s an open-sourced tool, so anybody can use it for free.
AdoptoMedia MMM tool
- MMM tool by AdoptoMedia is an automated, AI-based solution with a convenient user interface that can be deployed on-premises or as a SaaS. The tool was introduced in 2017 and since then has helped numerous companies in banking, e-com, insurance, pharmacy, and other industries with performance measurement and budget optimization.
We’ll try to compare Facebook Robyn MMM to what we do in AdoptoMedia and highlight its advantages and disadvantages in this article by going step-by-step through the process from gathering data and setting up the model to the interpretation
Main steps of MMM analysis
We can summarize the process of MMM analysis into a few milestones and see the solutions offered by Facebook Robyn and our tool:
- Data preprocessing and setting up the model
- Model training and validation
- Extracting useful information and insights for the business (interpretation)
Data preprocessing and setting up the model
Every model starts with data, and this step must be the most important part of any analysis. The quality of the model and the validity of conclusions we make based on the results highly depend on the quality of the data. It is important to put into the model reliable business logic by testing and choosing the right features.
Facebook Robyn does not provide any UI, the package is built using R: the popular programming language commonly used by researchers, mathematicians and statisticians. To set up a project you need to use the template written by the authors of this package, it looks like an R script with ready-to-go instructions and useful comments through the process of modeling:
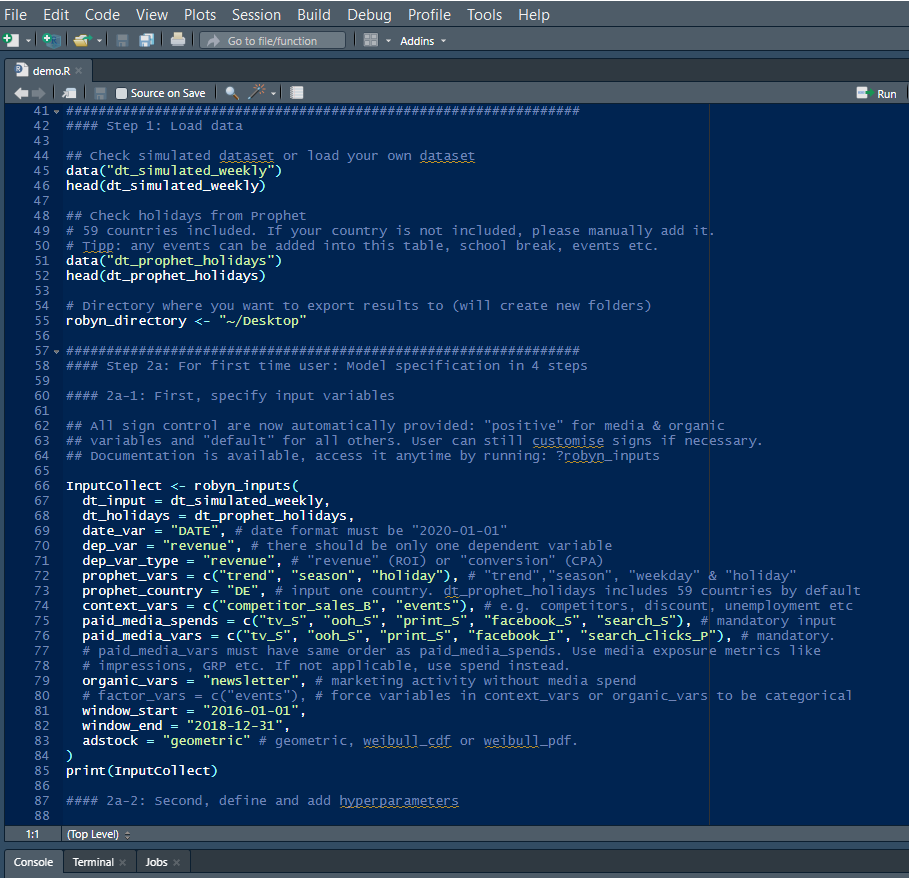
The data preprocessing step is supposed to be done and input data should be complete before it is used in a model. Robyn offers only a few built-in feature engineering steps: it may help to make a seasonality decomposition and generate holiday dummies based on the built-in dictionary that contains the main holiday dates for most countries. It depends on the business, but the dependent variable (e.g. sales, conversions, traffic) will likely be impacted by underlying seasonality trends which should be considered in the analysis.
Unlike Robyn, our tool has a pretty simple and comprehensive UI at the same time, which lets you choose factors to include in the model (or to test them after). We call this a “recipe” — it definitely looks like one if we assume the model is something to be “cooked” and the instructions are the recipe book where we show what and how to combine. We define a feature as a combination of various components, and the combination method is specified in “operation”. By default, it’s the sum, so all the components (factors) are added up and assigned to the given “Feature name”:
With our tool, it is possible not only to test different components of the feature (by specifying operation = “any” for a given Feature) but to let the tool decide which of the Features should be included in a model if it increases its accuracy and does not compromise its generalization ability at the same time. It can be done by changing the “importance” column from “required” to “optional”.
Our tool also offers to automatically generate seasonality decomposition using the same Meta open-source project Prophet used by Robyn for forecasting time series data so it does not require generating this manually.
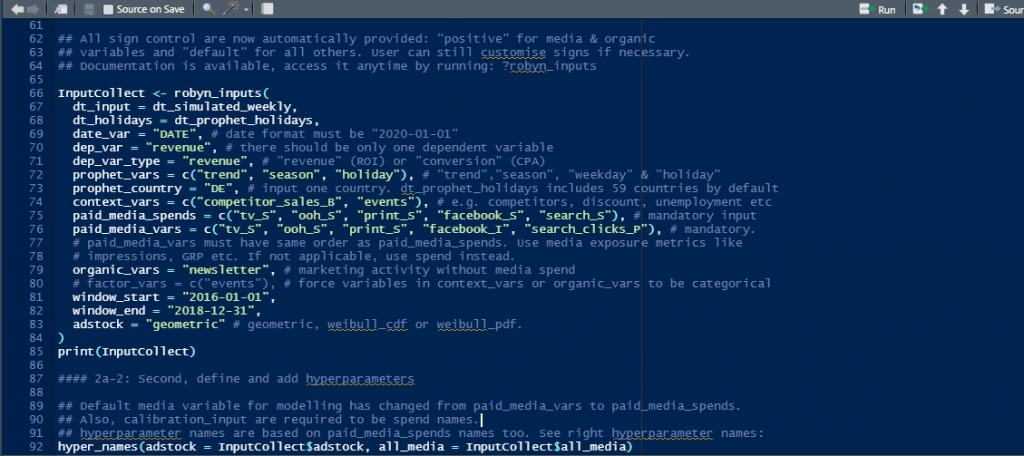
As it’s shown above in the screenshot, for Robyn you should specify all the factors which would be included in a model.
In Robyn, if you want to test different factors (e.g. different macroeconomic factors) you should train another model each time.
When the data preprocessing step is done and the final specification of the model is determined, it’s time for the next step: training.
Model training and validation
Before the training step, it’s crucial to take into account the limitations of regression models and be aware of their peculiarities.
The first one is a problem of multidimensionality: the number of features in a model is constrained to the number of observations. The common rule of thumb is to have at least 8-10 observations per feature, which means that for 2 years of weekly data (~104 observations) there shouldn’t be more than 10-13 features in a model. This figure includes the constant or the base, which represents the average amount of sales (or any other KPI) you get naturally without the impacts from media and context (external) variables.
The problem gets more complicated, as a model should evaluate many other unknown variables. Each media channel has at least 3 more additional parameters that help to display the nonlinear effect of media on sales: adstock parameters (adstock/decay effect, saturation and lag), so the final number of variables can reach up to 50 or even more. It leads to instability of the final results, for example you might end up with several “optimal” models that could have comparable decent accuracy but show completely different impacts of media and ROAS for different channels. Robyn MMM is able and advises to use a-priori information such as the A/B experiments results for channels to help the model get a more suitable business result.
Another problem arises when there are several marketing activities that are correlated to each other, e.g. going on-air at the same period. This is called multicollinearity and it leads to a problem with calculating the real impact of each independent variable or distorted impact estimates (usually overestimated for correlated variables). Robyn uses a so-called “regularization” technique that introduces intentional bias to estimates. Mathematically, it is the right thing to do to improve the predictive performance of MMM but in practice it often leads to extremal and strange results. For example some media channels might be given an impact value close to 0 even if their spend share is higher than that of other channels.
We try to solve the described problems by introducing another scaling parameter for some features that are correlated to each other. It allows us to evaluate channels on a more granular level, measuring not only the overall performance impact but also getting separate estimates for different formats: paid search, remarketing etc. Definitely, this technique makes the task of parameters evaluation even more complicated because the number of parameters gets bigger. It might lead to the same problem of getting almost unlimited “optimal solutions”, so we strongly recommend using prior knowledge for model calibration. Our tool also allows users to input “calibration”, a-priori information such as A/B experiments results, industry benchmarks, the results of previous MMM/multi-touch attribution in a form of contribution shares to the KPI over the modeling period, and other parameters such as adstock boundaries or an approximate saturation level for known channel’s spend capacity etc.
After the model design is finally specified and it is ready for training, we have to configure a couple of additional parameters:
- Train and test (validation) period: the model should be tested on the out-of-sample period to prove its generalizing and predictive power. By default, we can use an 80/20 % rule: 80% of observations will be used for training and 20% for testing the predictive power of the model. It’s also important to have in mind the following rule of thumb for choosing the model window and a number of Factors in a model: the number of observations on a training period should be 8-10 times more than the number of Factors (variables)
- The signs of coefficients: sometimes it makes sense to assume that certain variables should have a specific direction of impact. For example, we usually expect our own media to have a positive impact on KPIs and a negative impact on the competitors’ media.
- Categorize variables into Media and non-Media factors: here we’ll use Robyn guide for terminology: Paid Media, Organic and Context variables.
Paid media and organic variables (media) are any media variables or marketing activities with or without a clear marketing spend: a special non-linear transformation will be applied to these variables to reflect carryover effects (i.e. adstock) and saturation (diminishing returns on investment).
Context variables (non-media) are other external factors such as demographic, macro-economic factors and competitive presence which are beyond the control of marketers, but have a significant impact on the dependent variable.
All these parameters can be set in a Robyn template demo.R script shown above, or on the same “recipe” page in our tool.
The training step is where all the mathematical magic comes into place: the algorithm should find an optimal solution by finding all the unknown parameters of the model: regressions coefficients of the quantitative relationship between independent (Media. Organic and Context) and dependent (KPI) variables and adstock parameters for media and/or organic variables.
Facebook Robyn uses a gradient-free optimization algorithm Nevergrad designed to find optimal model solutions that minimize 3 optimization scores. Two of them provide statistical quality of the model (MAPE and Normalized Root Mean Square Error (NRMSE)) and the third one is decomp.RSSD (shows how much spend share differs from a channel’s coefficient decomposition share).
Our tool passes more statistical tests which increases its accuracy. We also use a similar gradient-free Bayesian optimization algorithm with the Bandit-Based Approach (Hyperband, https://arxiv.org/abs/1603.06560), but with a much more diverse number of optimization scores compared to Robyn. It controls not only the main quality metrics of the model such as MAPE on train period and MAPE on hold-out set, R2, but other essential assumptions and conditions for regressions, to ensure that estimates are effective and not biased, e.g:
- Ljung-Box and Shapiro-Wilk test to check for unaccounted autocorrelation of time series and make sure that residuals are normally distributed accordingly, which allows us to be sure that the confidence intervals of estimates are not biased. This means the finance team can use them to estimate financial risks of marketing spending, test hypotheses etc.
- Ramsey’s RESET test to determine whether the functional form of the regression is appropriate.
- VIF, to check for multicollinearity.
And of course, there is an option to include and control prior information for additional calibration: decomposition share, adstock and saturation level parameter boundaries.
Eventually, our optimal model solution provides not only business-suitable results but a statistically validated model, which could be tested and pass even the strictest independent audit test.
Extracting useful information and insights for the business (interpretation)
After the model is trained and the final optimal version is chosen, we’d like to create outputs from the data so that it is easy to visualize and understand the results.
Facebook Robyn generates a convenient one-pager with the most valuable results: quality metrics of the model, decomposition share of factors, mROIs and adstock effects of media channels, confidence intervals for mROIs of media channels, response curves (showing the saturation effects of marketing spending on conversion):
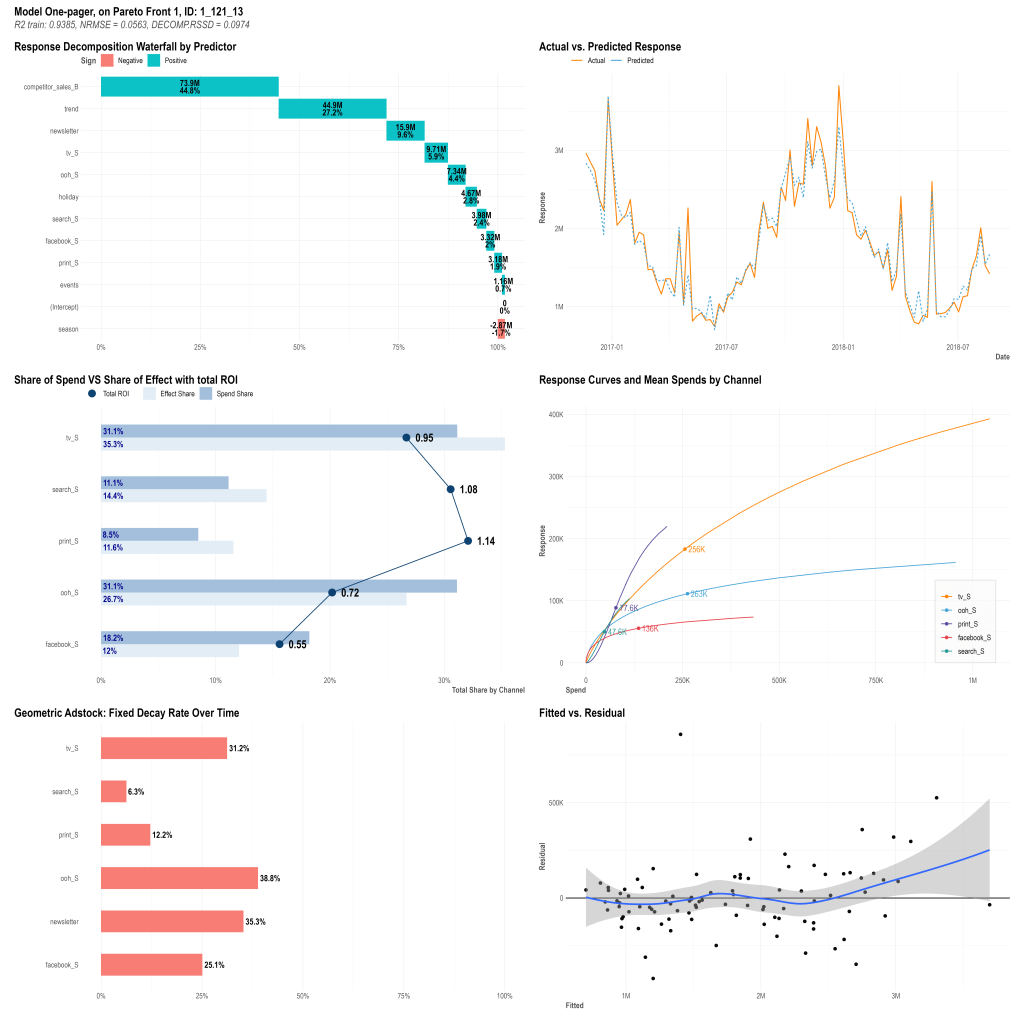
You can also get an optimal media budget allocation and see how to change media-split to maximize response. The latest release of Facebook Robyn also has a built-in function to build a forecast on a hold-out sample (validation set).
It’s possible to extract some more information such as decomposition in dynamic on certain periods by going deep down to the output data of the model generated by Robyn MMM. If you need some more interactivity such as changing response curves depending on the budget, you might have to look through the Robyn documentation and sometimes the source code.
With our tool, you get all the results above in a convenient automatically generated Excel report with a built-in forecasting feature that allows you to test any what-if scenarios of interest: from testing different marketing plans to optimizing media split to reach a specific goal (maximum conversion with minimum budget, or maximum conversion with fixed budget):
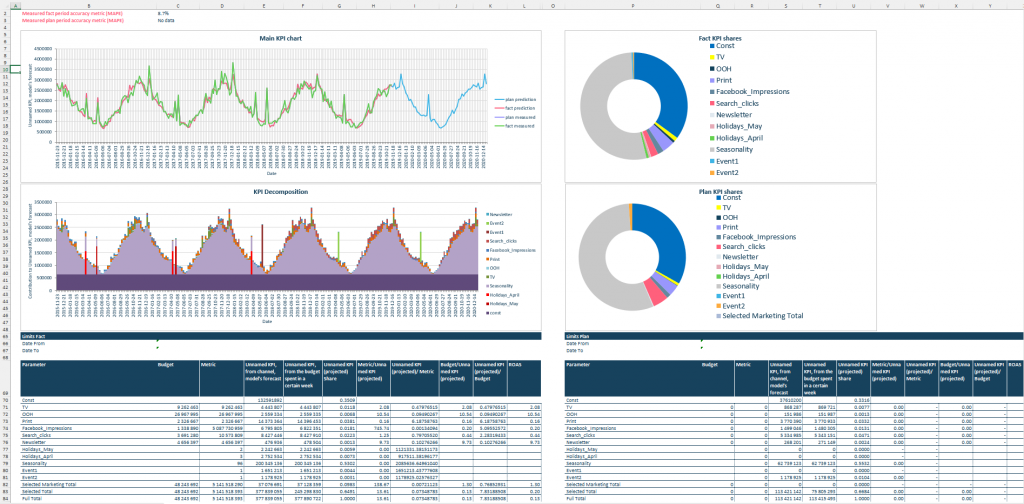
On the main page, you’ll find real-time forecast and decomposition plots based on input data and performance metrics for each factor based on the results of a marketing mix model (contribution to KPI, % of contribution to KPI, Budget, ROAS or CAC, etc.)
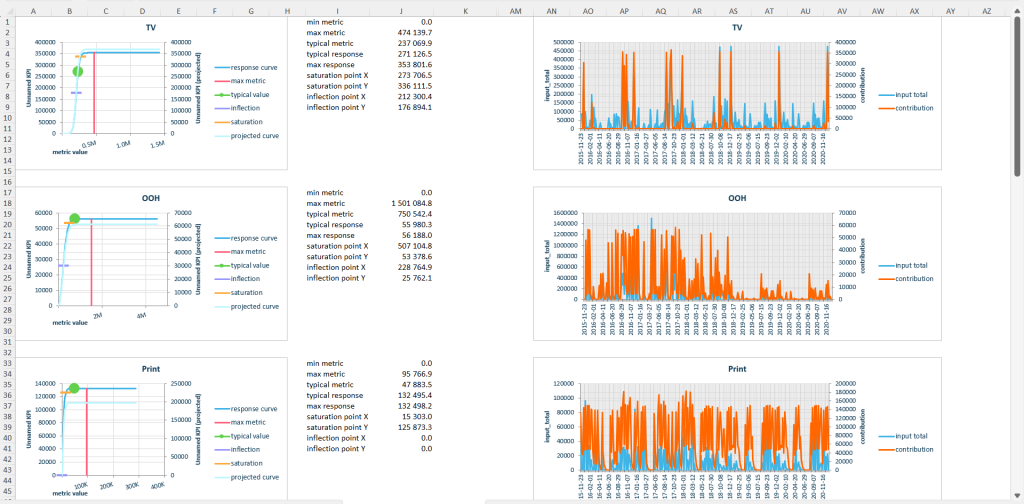
Additional sheets contain response curves and metric vs factor contribution plots to give an overall picture of performance for each media channel. These visuals help to determine whether the channel spend has already reached its saturation point and whether there is a potential to improve ROAS, etc.
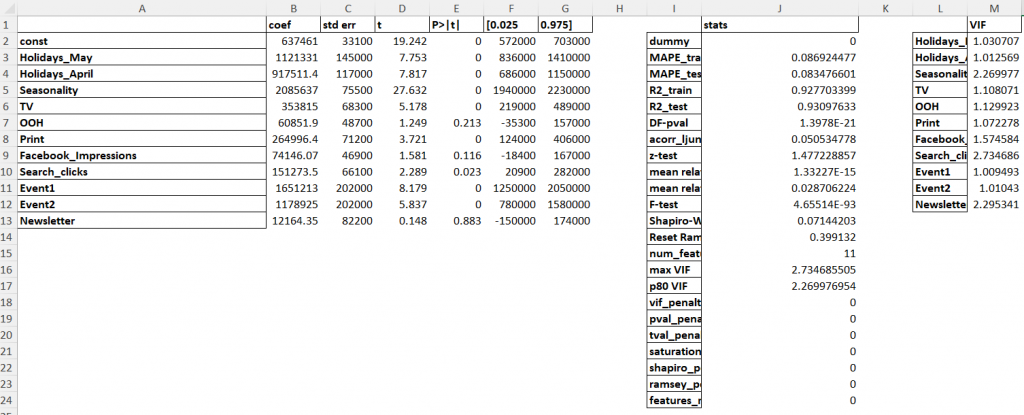
The report also contains regression summary statistics and statistical tests results, which might be useful for analytics or validation purposes: we genuinely believe that model transparency and interpretability is the key to customer confidence.
What MMM option should I choose?
Here are pros and cons for Facebook Robyn and Adoptomedia tool (the information about Facebook Robyn also applies to Google lightweight and other open-source MMM):
| Facebook Robyn MMM | AdoptoMedia MMM | |
| pros | No ongoing costs to run MMM, aside from team costs. Robyn is a suitable option for businesses that want to manage fully in-house analytics. It’s suitable for simpler models not overloaded with a large number of factors to estimate and businesses with a traditionally significant and solid media contribution (e.g. Pharmaceutical industry). Automated generation of a One-Pager report with the main insights based on the chosen model. | Suitable option for teams, less specialized in MMM or analytics. Offers a fusion of end-to-end service and semi-automated MMM tool: requires the least amount of your team’s time and effort, does not require your team to have advanced skills in marketing concepts or any software/programming skills aside from entry-level Excel knowledge The best option for large data sets and complex model specifications (a large number of factors, 2-stage least square regressions to account for additional effects of reach media on paid search, panel data etc.) Generates a ready-to-go Excel report with model outputs and business insights with a forecasting feature and what-if scenarios |
| cons | It requires in-house analytical or data science resources: users must have data science expertise and software/programming skills necessary to run and update the models. Users should have a solid understanding of marketing concepts and statistics in order to interpret the results correctly. Difficulty in scalability (handling large data sets or a large number of factors). Ad hoc tasks and what-if scenarios automation require creating add-ons above the Robyn base framework. | Fee charge per model |
No matter what approach you choose for your marketing mix modeling, the key to success is ensuring that the model is transparent, interpretable, and not biased. The most important thing is to choose a solution that aligns with your team’s skills and resources, the complexity and scope of your task, and can provide reliable and actionable insights to optimize your marketing strategies.