Accenture is one of the leading global consulting firms, providing a wide range of services and solutions across over 40 industries and various business functions in more than 120 countries. The company combines business and technology to improve its clients’ performance. In one of their articles they cover the development of Marketing Mix Modeling (MMM) and Optimization through years including the latest techniques and implementation of granular data in MMM.
This article is a summary of how Marketing Mix Optimization has changed over the last 40-30 years becoming more effective with every innovation, but there are still some limitations to this approach.
Promotion is vital for a business’s success, and MMO helps to make sure that different media channels are used in the most effective way by creating a statistical model and analyzing its results to ensure optimal budget allocation.
The following three stages of MMO evoludion will be covered:
- Similar Linear Regression
- Mixed Model
- State Space Model
The article is presented as a case study of a toy manufacturer, ToyCo, which has a $100 million media budget. The manufacturer wants to understand what portion of its sales can be attributed to advertising and which channels have the most impact on sales.
Similar Linear Regression

Marketers used these easily interpreted models in the 1980s and 1990s. When using regression models, we assume that there is a linear relationship between the dependent variable (sales) and independent variables (promotional activities and external factors that also affect the success of ad campaigns, such as demographic or macro-economic landscape). These external factors can be included in the models in such a way that we can still view marketing-driven sales separately. Additionally, MMM can also show how specific marketing tools impact sales. The calculations provide information on the rate of change in sales for every variation in marketing activities.
In case of ToyCo we have the following results:
for every $1 spent on Direct Mail we get $2 incremental in revenue,
while for TV the incremental in revenue is $1.75.
The numbers show that the current marketing mix can be improved by increasing the use of Direct Mail and reducing TV ads.
Regression models work well only when there is a linear relationship between sales and marketing activities, which is not completely true. Accenture points out several variable factors in advertising
- Adstock: advertising loses its initial effect on sales over time.
- Saturation: the amount of money you invest in a certain marketing activity is not directly proportional to the incremental revenue it will generate, because every next spent dollar generates less revenue.
- Lag: the effect of advertising is not always immediate, so it might take a few weeks before a consumer buys your product after seeing an ad.
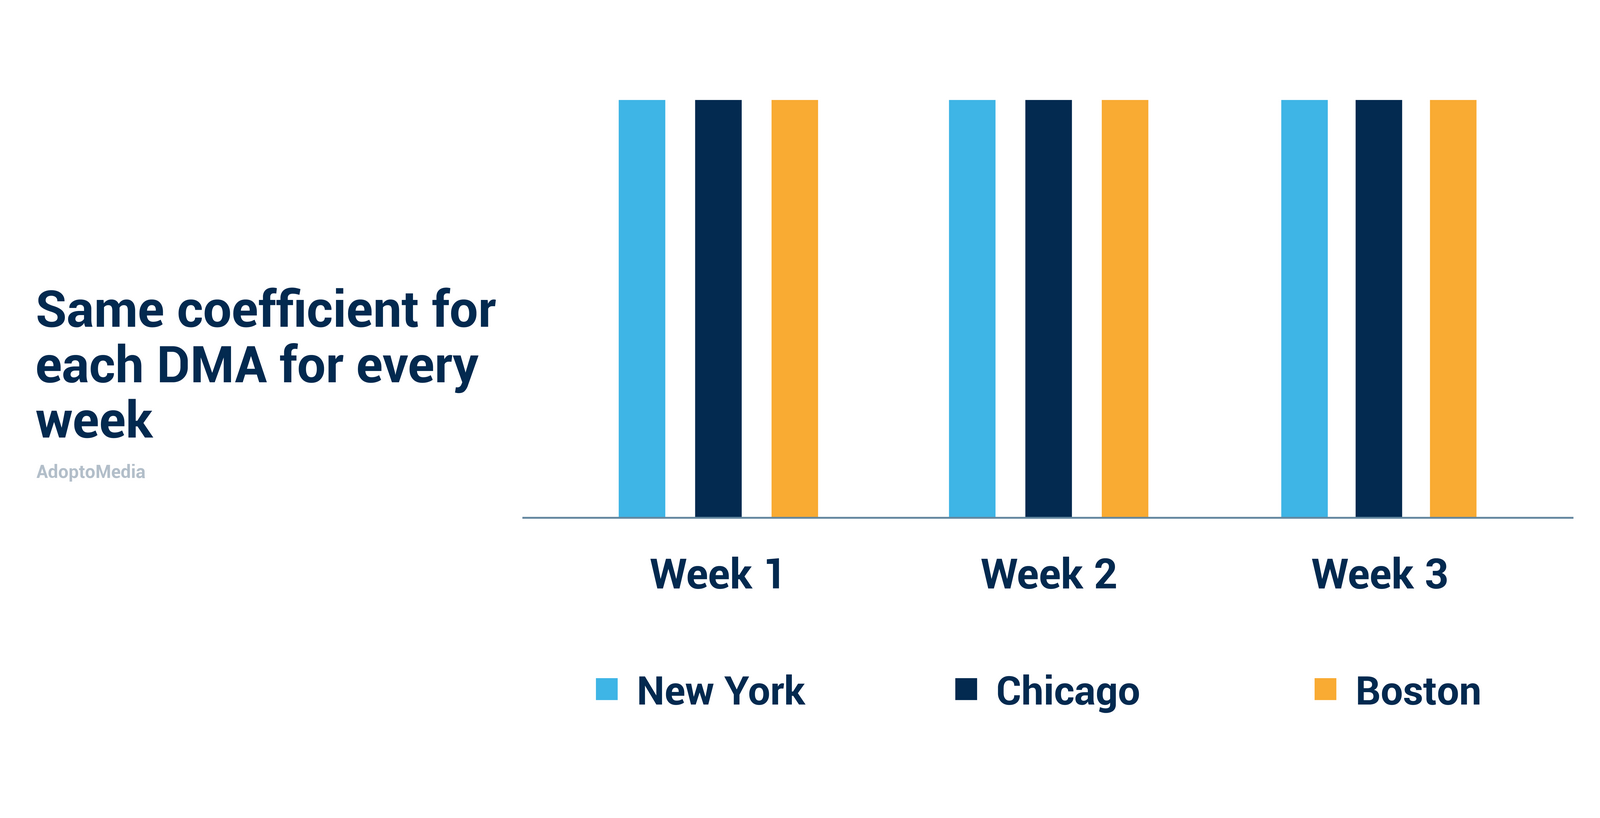
If you apply these factors, it compensates for some of the drawbacks of a linear model, but it does not address other significant issues. For example, if there are numerous ToyCo stores across the country, the company would prefer to optimize its marketing strategy for each individual store or direct marketing area (DMA), which is a common practice in the US today. Unfortunately, this would be impossible with the aforementioned regression model, as it views each DMA as identical. To solve this problem, we need a different modeling approach that can analyze each DMA separately.
Mixed Models
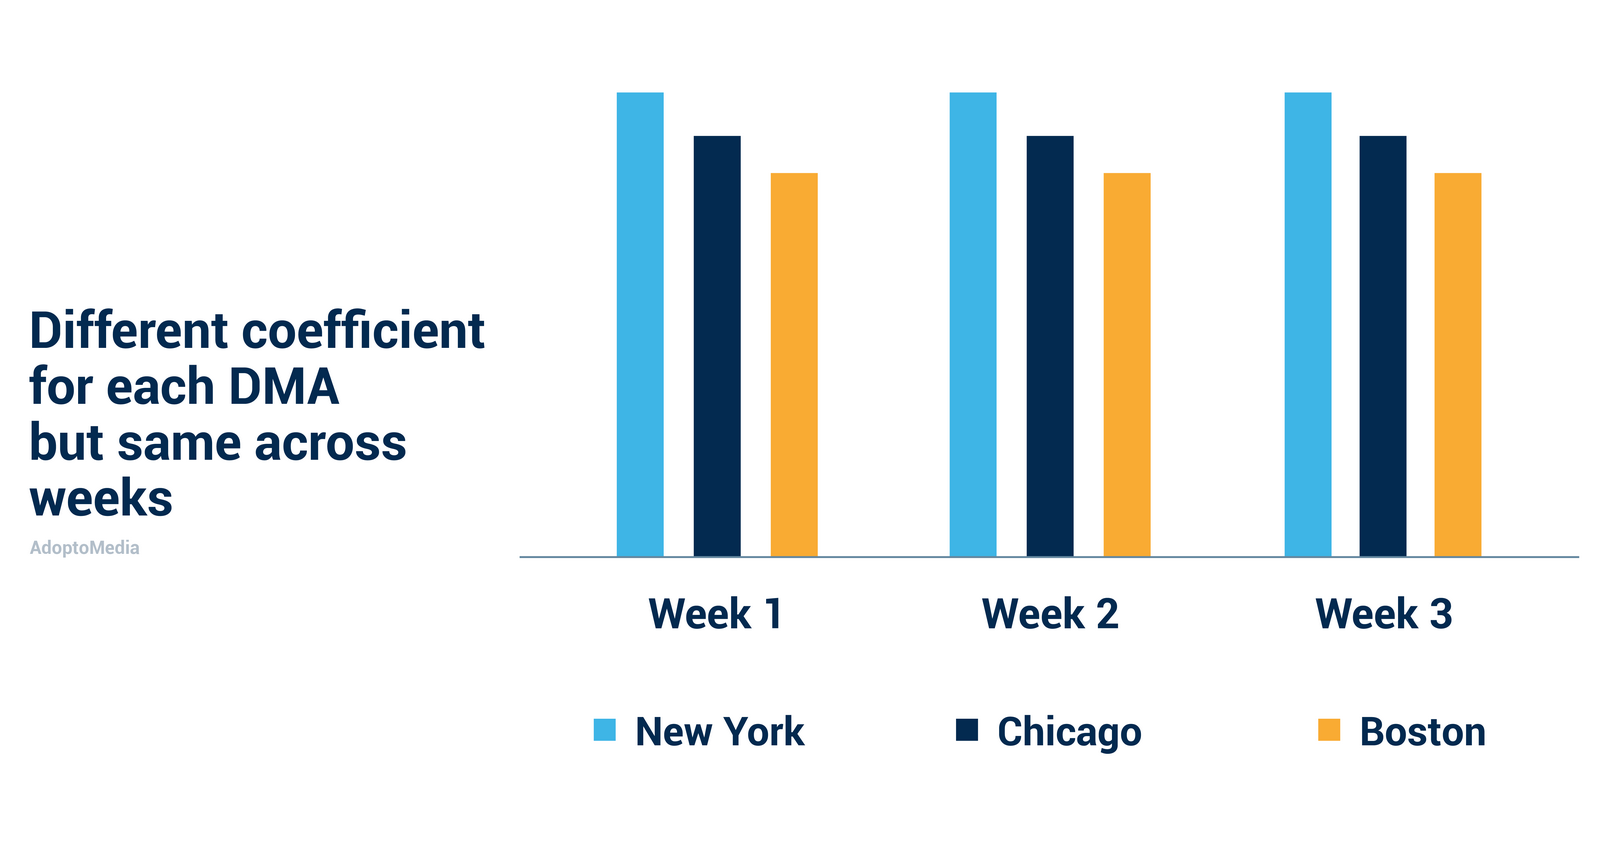
Mixed Models allow to set your marketing strategy at a DMA level using the same linear relationship as above but introducing a random coefficient to improve it. The random coefficient is the incremental revenue at each DMA driven by a certain marketing activity, which later along with the fixed coefficient – the average incremental revenue across all DMAs – helps create models at more targeted levels. In ToyCo case DMAs are considered, but the focus could be narrowed down even to a single store.
While regression model for ToyCo showed that Direct Mail drove $2 in revenue for every $1 investment, in the mixed model, we can see that
New York gets $2.50 for every $1 spent, while Chicago gets $1.50.
These results allow us to further optimize the marketing strategy, by increasing investments into Direct Mail in New York and reducing them in Chicago.
Even though mixed models provide satisfactory, targeted output, proper and precise estimation requires considerable amount of data. Another drawback is that results are based on data sets covering up to several years and computed as an average, while it is recent periods of time that are more relevant for companies.
For example, in the late 2000s, the global economy crashed, which caused the decline in marketing spends. At the same time, digital advertising platforms were on the rise with their lower cost and greater personalization. The quantity of advertising campaigns increased, and the intervals between them became shorter. The dramatic changes required rapid adaptation from marketers: they had to react faster to the latest trends, while also being able to estimate the efficiency of various marketing activities at different points in time. As a result, classic regression approaches gave way to a new technique that is much more responsive to the latest trends and challenges.
State Space Modeling

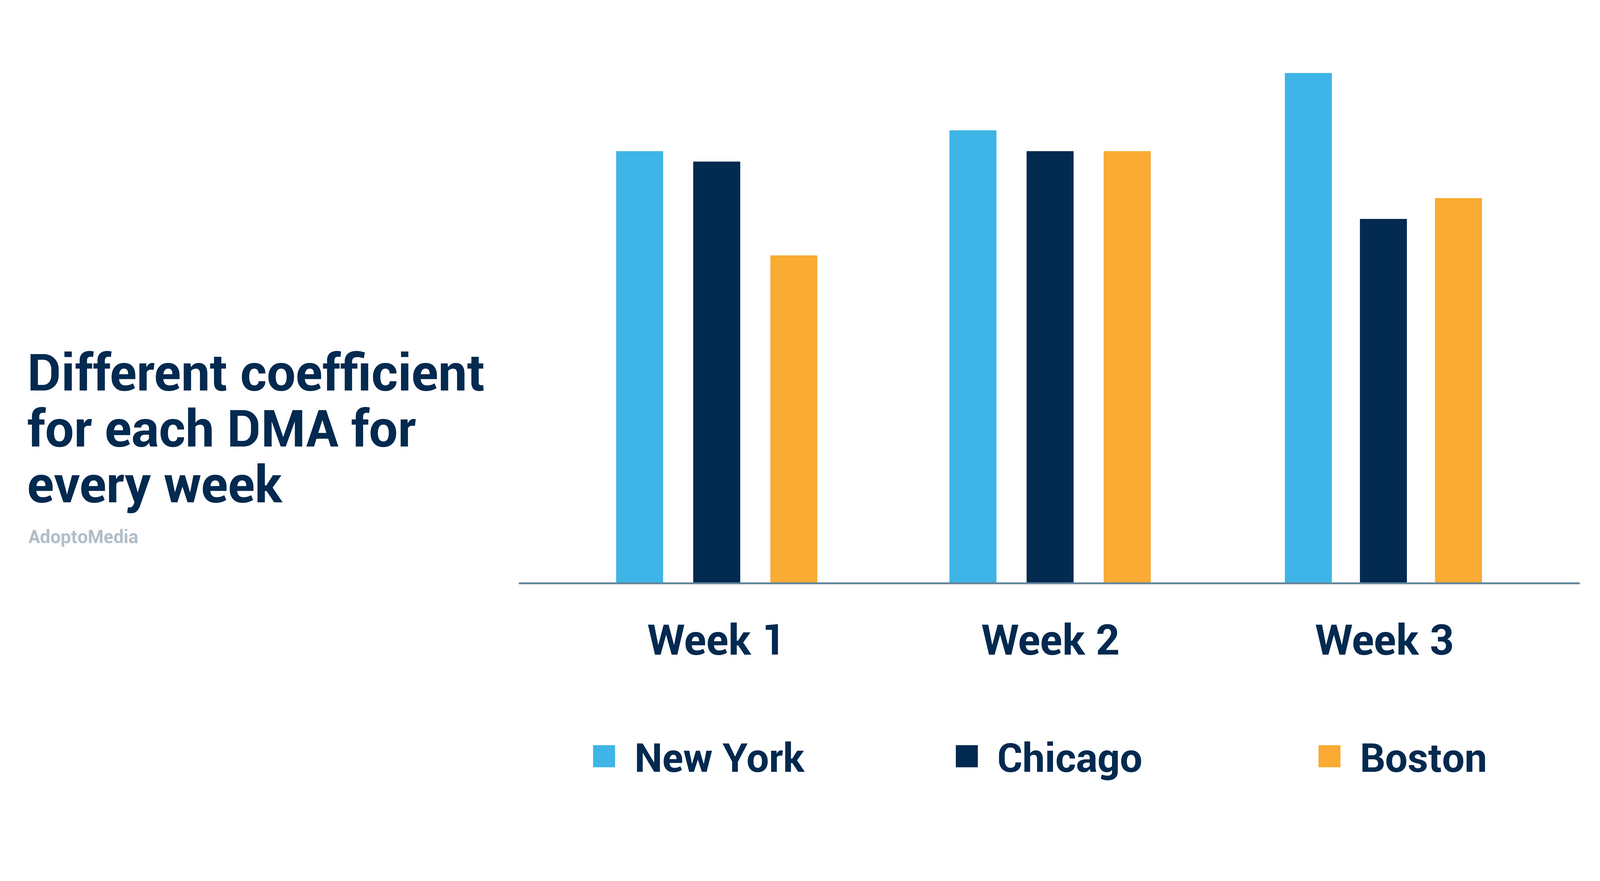
Back to ToyCo, let’s suppose their sales decline sharply due to a macro-economic situation, and the company decides to reduce their marketing budget from $100M to $75M. But they don’t want this budget cut to be random: they plan to reduce the amount of advertising campaigns for a period of time that will least impact overall sales. To make this possible, we need a strategy that can account for both seasonal and geographic factors. That’s exactly what State Space Modeling (SSM) allows you to do. Just like previous models SSM distinguishes baseline sales from those driven by marketing activities, but it also included two innovations. Firstly, it views baseline sales not as an average figure for the year, but accounts for how they fluctuate over the period. Secondly, it calculates the effectiveness of a marketing activity at different points in time, as opposed to finding one average coefficient for the whole period of time. As a result, the rise in sales during December before the holidays and the subsequent decline will be attributed to seasonality rather than to the marketing activities implemented at that time. In contrast, prior modeling approaches would incorrectly attribute those fluctuations to the media mix.
Here is what we get if we compare all three models.
Linear regression shows that Direct Mail drove $2 in sales for every $1 invested
Mixed models show that Direct Mail drove $2.50 in NY and $1.50 in Chicago
State Space Model shows that in the final week of November we get $1.50 for every $1 invested in Direct Mail, but in the 1st week of December we get $3.50 for every $1 invested in Direct Mail.
The new approach also uses current data to predict future sales. For example, if ToyCo chooses to analyze their sales on a weekly basis, this technique will predict this week’s sales based on last week’s sales. Additionally, it continuously uses insights from any given week when planning the marketing mix for the following week.
However, it is also important to design marketing strategies at the DMA level, which can be achieved by implementing a separate State Space Model for each DMA. This will require significantly more resources, but it will ensure that all media channels are utilized to the best advantage of ToyCo.
Moreover, this third model is not the final stage of Marketing Mix Optimization evolution; it can further be enhanced.
AdoptoMedia offers accurate and advanced econometric models for marketing mix evaluation. We help our clients to measure the incremental impact of every channel in the media mix by product and region, find ineffective ones and optimize the budget allocation. Our platform allows for in-campaign tactical adjustments to adapt to changing market conditions and increase ROMI by 10-30%. Advanced AI technology updates ROMI models with ingestion of new data.


